HTML Content - Custom Visual for Power BI
Change Log
Change Log
1.4.1 (2023-09-20)
- DIN has been added as a valid font (you can use either
dinorwf_standard-fontin your styling to use). - Iframe display functionality was failing due to breaking changes to the custom visuals APIs in 1.4.0. This has been restored, but note that the previous restrictions on iframes will still apply.
1.4.0 (2023-08-04)
New Features
Interactivity features for Power BI have been introduced, which provide some additional capabilities for your designs:
- Tooltips
- Cross-filtering
- Context menu and drillthrough
Note that these have their own considerations, depending on how you are configuring your visual, so please refer to the Interactivity page for more information.
Bugs Fixed
- If your page has right-to-left direction (or you are styling the visual's
<body>element manually to achieve this), the scrollbars will now be rendered on the correct side.
Specific Changes Applicable to HTML Content (lite)
These are only relevant to HTML Content (lite), which is the certified edition of HTML Content.
- Most available HTML attributes have been enabled, with the exception of anything that can be used for scripting (sue to certification limitations).
- SVG elements are now available. The follwoing tags are unavailable due to potential XSS vulnerabilities:
<foreignObject><script><use>
1.3.0 (2023-06-05)
New Certified Edition
A new edition of the visual named HTML Content (lite) is available in AppSource, which is a certified version of the visual. This is almost identical to the standard edition, but with a reduced set of available tags and attributes, to comply with Microsoft's certification requirements. You can read more about the differences between the two editions on the Editions page.
Due to the required visual APIs needed to support this edition, the minimum required versions are:
- Power BI Desktop: November 2022
- Power BI Report Server: May 2023
Note that as all changes in this version pertain to the certified edition, the standard edition will remain at version 1.2.1.
1.2.1 (2021-07-16)
Bugs Fixed
- 1.2.0 was using the latest Power BI Visuals API (3.8.0) but some versions of Power BI (e.g. Report Server) haven't caught up yet, so this has been reverted to 3.5.1.
1.2.0 (2021-05-24)
New Features
Allow Text Select
The Content Formatting menu now includes a Allow Text Select property, which if enabled, will allow users to hightlight text using their mouse. Highlighted text can be copied to the clipboard with Ctrl + C (or system equivalent).
Note that the visual context menu context and associated logic is specified by the main Power BI window, so it is not possible to use this to copy selected text.
Measure-Based Stylesheet
Refer to the Stylesheet page for more information on how this works, and how to set up.
Minor Enhancements
Show Raw HTML
If the Show Raw HTML property is enabled, HTML is now displayed in a read only textarea element, e.g.:

This is scrollable, and it is possible to select text and copy to the clipboard with Ctrl + C (or your system's assigned shortcut).
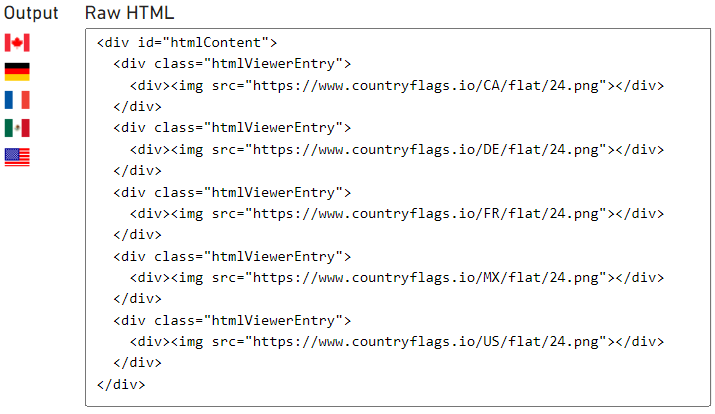
The raw HTML will also include the div used to encapsulate all body content, and the div used to encapsulate individual rows from the visual dataset, which may also help with identifying how the DOM is structured, and for identifying CSS selectors for standard elements.
If a stylesheet has been assigned via a measure (as detailed above), the resolved CSS will also be included in a style tag.
1.1.0 (2021-01-05)
Minor Enhancements
"No Data" Message
Previously, the message displayed if there was no data available was hard-coded. The visual has now been modified to expose a "No Data" Message property. You can read more about how to use this feature on the "No Data" Message" page.
Default Title No Longer Used
When creating a new instance of the visual, the title will no longer be shown be default (like for the table visual). This can be enabled or modified in the usual way in the properties pane.
1.0.2 (2020-08-28)
Minor Enhancements
Sorting
The visual would previously sort in the value order supplied from Power BI (typically alphabetically).
Standard sorting has been added to the visual, which is accessible from the visual header in the usual way, and will now permit you to sort by any measures or columns added to the visual's fields.
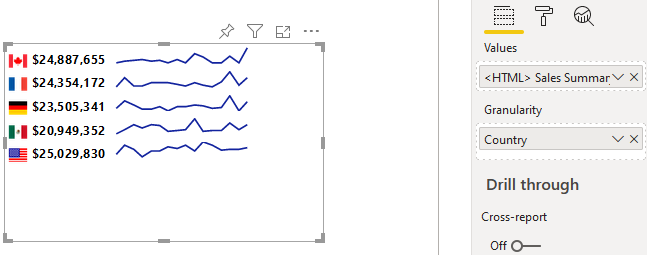
For example, if we have a visual that contains Granularity for Country, and measure that generates HTML to render the flag, total sales, and a sparkline of sales over time, there's quite a lot going on here. Power BI would sort it based on the query result, which would likely be by the Granularity field order (i.e. Canada first, USA last):

Now, we could specify that we sort by the Country in reverse order by choosing the standard sorting options in the visual header, e.g.:

But what if we want to sort by total sales?
As there is an existing row context for Country, we can add our \$ Sales measure to the Granularity field. This will resolve to the same value that's displayed in our HTML measure, and because it's in the visual's data we can sort by it, e.g.:

Because values in the Granularity field are used to generate row context for the visual and do not get rendered, you may need to consider what happens to your HTML by adding columns or measures to this field, but this should provide a pretty decent level of flexibility here.
List Items
The visual would not render ordered (<ol/>) or unordered (<ul/>) line item (<li/>) elements due to styling applied higher up in the custom visual host container. This has been resolved to work as expected, e.g.:

1.0.1 (2020-07-28)
Initial version released to the Power BI Marketplace.